MOLECULAR SCALE CAPACITORS
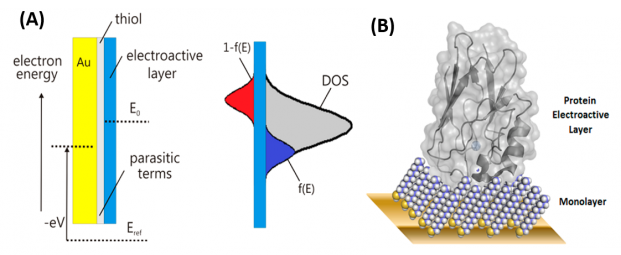
Capacitance at molecular scales is closed related with quantum capacitance phenomenology or the so-called electrochemical capacitance. The molecular scale capacitance is especially important for low density-of-states systems, such as 2-dimensional electronic or electrochemical systems in a semiconductor or electrochemistry surface, electrochemical interfaces and/or in graphene compounds. Electrochemical capacitance in graphene or electro-active molecular layers is accessible by capacitance spectroscopy as follows:
CAPACITANCE SPECTROSCOPY
Capacitance spectroscopy is a simple method that uses an entirely novel application of electrochemical impedance spectroscopy to map out the thermodynamic and kinetic characteristics of electrochemistry surface at nanoscale, for instance, confined electro-active films.
Dielectric spectroscopy is derived from impedance spectroscopy; ![]() is the complex capacitance. Note that
is the complex capacitance. Note that ![]() is the unitary complex number. Dielectric spectroscopy is majorly applicable in solid-state systems so that dielectric spectroscopy is based on the conversion of this complex capacitance
is the unitary complex number. Dielectric spectroscopy is majorly applicable in solid-state systems so that dielectric spectroscopy is based on the conversion of this complex capacitance ![]() into a dielectric complex function, such as
into a dielectric complex function, such as ![]() is a constant geometric factor
is a constant geometric factor ![]() , referred as the capacitance of empty cell, where
, referred as the capacitance of empty cell, where ![]() is the dielectric permittivity of the empty space,
is the dielectric permittivity of the empty space, ![]() is the length separating the electrodes, and
is the length separating the electrodes, and ![]() is the area of the electrode.
is the area of the electrode.
Therefore, ![]() term only depends on geometric factors applied during the measurements and follows the experimental setup that delineates the adopted cell’s geometry. In general, the impedance and capacitance complex functions are just one form of a more general terminology known as immittance (complex functions). Accordingly, all of these functions are associated with particular classes of immittance spectroscopy (impedance, capacitance, modulus, etc.). Historically, because the complex impedance function is the most used, all other immittance spectroscopies are said to be impedance-based methods.
term only depends on geometric factors applied during the measurements and follows the experimental setup that delineates the adopted cell’s geometry. In general, the impedance and capacitance complex functions are just one form of a more general terminology known as immittance (complex functions). Accordingly, all of these functions are associated with particular classes of immittance spectroscopy (impedance, capacitance, modulus, etc.). Historically, because the complex impedance function is the most used, all other immittance spectroscopies are said to be impedance-based methods.
When the studied system is electrochemical in essence, there is an electrochemical potentiostatic control of the external potential; thus, when it is used specifically for electrochemical systems, impedance spectroscopy is termed electrochemical impedance spectroscopy. Nonetheless, in electrochemistry, the cell’s geometry is difficult to determine, especially in those cases in which the electroactive material, assembled over the working electrode, is mesoscopic in essence, i.e. in which a geometric factor cannot be established or determined precisely. Given this situation, our research group has proposed that the complex capacitance function is a useful approach in studying electrochemical systems, and we have referred to this approach as electrochemical capacitance spectroscopy (ECS). Note that ECS is comparable to dielectric spectroscopy, but applied to electrochemical mesoscopic systems, where the geometrical factor of the working electrode or electroactive material cannot be established.
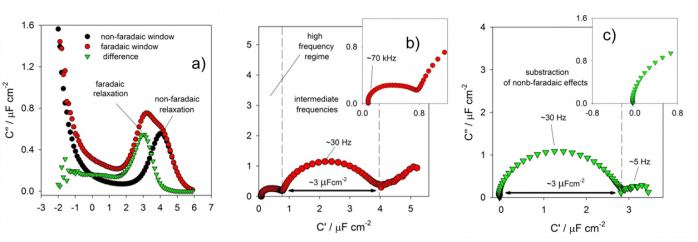
For instance, when ECS is applied to investigate monolayers of electroactive proteins assembled over gold electrodes, precise establishment of the geometric factor is challenging. (What would be the electroactive area of a redox protein?). In this situation, the applicability of the method is illustrated in Figure 1, which clearly shows the ability of the approach to separate both concomitant existing phenomena, electrochemical and non-electrochemical relaxations, spectroscopically. The electrochemical relaxation (associated with the transfer of an entire number of electrons; known as the faradaic phenomenon) is completely separable from the non-electrochemical relaxation (referred to as the non-faradaic phenomenon). This separation is obviously important in studying supercapacitance and pseudo-capacitive phenomena.


For instance, using ECS concepts, the Nanobionics group (in cooperation with Jason J. Davis group at the University of Oxford) was responsible for the development of a totally new label-free diagnostic assays. The ECS-derived assays are able to detect target protein at femtomolar levels allowing the establishment of early detection assay platforms for clinically important targets that are better than those currently in use and are potentially cheap and useful in multiplexed and bedside like-diagnostics, technologies.
